TAST tool Menu
TAST Adaptors
Adaptors examples
TAST Integrations
Interesting features
Documentation of technical administration
Modeling recommendations
Training in the TAST tool
TAST tool Menu
TAST Adaptors
Adaptors examples
TAST Integrations
Interesting features
Documentation of technical administration
Modeling recommendations
Training in the TAST tool
This option of the TAST tool allows the user to manage UML diagrams and Test Set Data.
This option of the TAST tool allows the user to manage all the treatments associated with the UML diagrams.
UML diagrams are completely necessary for the creation of the test cases. That is because every message of the diagram represents an action that will be carried on in the test (click or type, for instance).
In the next paragraphs, it is explained how can an UML diagram be created:
When logged in the tool, the user can see a menu in the left side (see First steps in TAST for further info). In this menu, the user will click on the button “Modeling”. After this, there will open a window where the user will select the domain and project where the test case will be included in.
IMPORTANT: The projects and domains need to be created before the creation of the test case and, also, the user needs to be assigned to the domain and project. Otherwise, the user will not be able to see neither the project-domain, nor the test cases that might have already been created.
For more info about the creation of the Domain and user, please check customize._domains_and_Projects page.
Once in the Modeling page, the user can proceed in three ways:

If the user chooses to modify an existing UML diagram (left side of the upper screenshot), there will be 4 different colors for the test cases: green for the cases where the mapping has been completed and validated, yellow for the cases where the mapping has been completed but not validated, red for the cases where the mapping has not been done, and grey for the cases that are empty.

When choosing to create a new UML diagram, it is needed to click on “New” button. After this, a new window will open as shown below.

In it, can be selected:
This option of the TAST tool allows create / modify a diagram.
Below, the screen to edit a diagram:

This screen allows:
In a message, by double click over it, is possible to indicate the type of action when the step is executed based on the following checkbox:

A guard is a logical condition that can be included in a UML message. The behavior is as follow, when the logical condition is true, the message is executed, when the logical condition is false, the message is NOT executed.
A guard is really useful when an action must or must not be executed, based on the result of a condition.

The conditions inside a guard can be of two types:
Following some examples about simple and complex conditions in a Guard:
In the mapping of a message, is possible to include a value with line skipping. For this, there is a checkbox 'Multiline Text':

If the checkbox is selected, an editor will appear to include the text:


This message has to be tied to another message between two objects and is painted in the opposite direction. The two messages form a set and are not treated separately.

 DATA MANAGEMENT: It allows modifying the javascript of each one of the diagrams.

This option of the TAST tool allows the user to pass information between sequence diagrams. Gates can be an easy way to model the passing of information between a sequence diagram and its context. A gate is merely a message that is illustrated with one end connected to the sequence diagram's frame's edge and the other end connected to a lifeline and represents another diagram.
About Gates, please consider the following important topics:
How to Create a Gate:
In the toolbar, select the Gate and draw on the lifeline. Double click and open the Gate properties, where you choose the domain, the project and the diagram you want to copy.

The selected diagram can be visualized by clicking on the icon of the image.

By clicking on the message map, it is displayed.

DATA MANAGEMENT: Allows to assign test case data to each Gate included in the diagrams.

EXECUTION OF TEST SET WITH GATES: A Test Set containing Gates is created and executed.

This option of the TAST tool allows the user to handle bifurcations and loops.
TAST allows the following types of combined fragment:


Subtestcases are test cases that can be drawn inside a diagram. The reason to implement the subtestcases consists in having a visual option to create test cases in a diagram instead of only in Data Management. Also, to obtain a result (or/and log) with an isolated portion of a diagram (test case) apart of the main result or log.
To use a subtest case in a diagram you have to go to drawing tools and click in subtestcase, then to draw it in the canvas click wherever you want to put it. You can also click ALT+S to select the subtestcase (as a shortcut).

Once it is drawn you can resize it with the little grey square in the bottom right of the sub test case (clicking holding and dragging it) and you can replace it the same way as the combined fragments.

To open the subtestcases properties, double click in the subtestcase and it will appear, here you can change the name of the sub test case (up to 100 characters) and add/edit a guard.
Also you can set a name with a variable like: “name of the subtestcase” + #Variable
It also works as: ‘name of the subtestcase‘ + #Variable

There are some things to keep in mind using subtestcases:

In Data Management once you have a diagram with a subtestcase (or various) the SubTestCase will appear as a red rectangle.

Data Management can be used as usually with the addition of subtestcases appearing there.
In results page a new functionality has been added, with the symbol of “+” you can click to deploy a new table with all the subtestcases an execution has. For example, in the following image:

We can see the result as always. But with the new addition:

You can now see the subtestcases results. Here you can download the evidences and the result document of the subtestcase.
In the result document:

In test case data description, you can see the name of the subtestcase, in case that the test case data had a description it will show you “testcasedatadescription_subtestcasename”.
In ALM it will show the full evidences of the execution, and all the subtestcases in the execution separatedly (also if you have gates with subtestcases those will be registered aswell).


When you want to delete a message from a diagram, the following window appears:

Below, the screen to manage the UML diagrams :

We can see the diagram information by clicking on the 'More info' icon.
You can page the diagrams using the page numbers at the bottom of the screen.
This screen allows:
- Create a new diagram (// New diagram // option).
- Save the information of the active diagram on screen (diskette icon).
- Delete a diagram, using the bin icon.
- Create a new folder (// + Folder // option).
- Select diagrams using user filters and mappings, clicking the filter icon.
- Deactivate the filters used, using the cross icon.
- Edit a diagram for its update, double click.
In the mapping Tab you set the information at the message level:
For the Input Parameters there are two important points to take in care:


In the mapping Tab you set the information of the parameters of the message. So, the “SearchBy” is the way to find an element in the parameter section (using tags) and the “Element” is the path you obtain from the real element to interact with.


And to finish this, the user have to put the information in the diagram.
In a TAST diagram, the messages (steps) non-reply can be documented using the “Message documentation” tab in the properties of the same.
In this tab it will be possible to document everything that should be stored in the evidence repository tools such as ALM, Confluence, etc.

This new tab contains the following elements:
MOVE DIAGRAMS TO A FOLDER
This option of the Tast tool allows the user to move a diagram to another folder of any domain and project to which they have access. To be able to use it you have to: Go to Model, click on UML Diagrams. The table is shown, where you have to click on the arrow icon located in the Actions column (fourth element). A pop-up appears, in which you select the domain, the project and the folder where you want to move the diagram. Click on “yes”. The diagram has been moved to that folder.


In a diagram, it is possible to use a set of global variables in all the parts where the help of variables is allowed (object mapping, message mapping, …).
The dropdown of variables (including global ones) will appear when typing the character '#':

In TAST, there are currently these global variables:
Below, the list of predefined functions and the indication of whether they generate evidences or not:
| Predefined Function | Adaptor | Generates evidences |
|---|---|---|
| connect | Database | NO |
| connect_DB | Database | NO |
| dBExecuteStatement | Database | NO |
| dBGetQueryData | Database | YES |
| disconnect_DB | Database | NO |
| getNumColumns | Database | NO |
| getNumRows | Database | NO |
| getTableValue | Database | NO |
| tableRecordCount | Database | NO |
| addSheet | Excel File | NO |
| deleteSheet | Excel File | NO |
| generateFileAsEvidence | Excel File | YES |
| getCellValue | Excel File | NO |
| getColumnByRowSearch | Excel File | YES |
| getExcelSheet | Excel File | NO |
| getNumColumns | Excel File | NO |
| getNumRows | Excel File | NO |
| getNumValueSearchOnColumn | Excel File | NO |
| getRowByColumnSearch | Excel File | YES |
| getTableValue | Excel File | NO |
| getTableValueByColumnName | Excel File | NO |
| getValuesByPosition | Excel File | NO |
| newFile | Excel File | NO |
| setCellValueOneParameter | Ecxel File | NO |
| setColumnValues | Excel File | NO |
| setHeader | Excel File | NO |
| setRowValues | Excel File | NO |
| setTableValue | Excel File | NO |
| setSheet | Excel File | NO |
| vTableLookUp | Excel File | YES |
| vTableLookupArray | Excel File | YES |
| allOptionsAreSelected | GUI HTML | YES |
| clear | GUI HTML | YES |
| clearAndType | GUI HTML | YES |
| click | GUI HTML | YES |
| clickByJavaScript | GUI HTML | YES |
| clickLink | GUI HTML | YES |
| clickPrint | GUI HTML | NO |
| closeAllWindows | GUI HTML | YES |
| closeOthersWindows | GUI HTML | NO |
| closeWindow | GUI HTML | NO |
| countElements | GUI HTML | NO |
| checkbox | GUI HTML | YES |
| checkRadio | GUI HTML | NO |
| doubleClick | GUI HTML | YES |
| deleteAllCookies | GUI HTML | NO |
| deselectAllOptions | GUI HTML | YES |
| fileDownload | GUI HTML | YES |
| fileDownloadDialog | GUI HTML | YES |
| fileUpload | GUI HTML | NO |
| getAttribute | GUI HTML | YES |
| isCurrentUrlContains | GUI HTML | YES |
| isCurrentUrlEquals | GUI HTML | YES |
| isCurrentUrlMatches | GUI HTML | YES |
| isDisplayed | GUI HTML | YES |
| isExist | GUI HTML | YES |
| isSelected | GUI HTML | YES |
| isTitleEquals | GUI HTML | YES |
| isTitleMatches | GUI HTML | YES |
| hasOptionWithValue | GUI HTML | YES |
| javascriptAlertAccept | GUI HTML | NO |
| javascriptAlertCancel | GUI HTML | NO |
| javascriptExecute | GUI HTML | NO |
| login | GUI HTML | YES |
| openUrl | GUI HTML | YES |
| optionWithValueIsEnabled | GUI HTML | YES |
| optionWithValueIsSelected | GUI HTML | YES |
| pressEnter | GUI HTML | YES |
| select | GUI HTML | YES |
| selectAllOptions | GUI HTML | YES |
| selectOption | GUI HTML | NO |
| submit | GUI HTML | YES |
| tableCellValue | GUI HTML | NO |
| tableCellXPathByPosition | GUI HTML | NO |
| tableColumnsNum | GUI HTML | NO |
| tableHLookUpXPath | GUI HTML | NO |
| tableHtml | GUI HTML | YES |
| tableRowsNum | GUI HTML | NO |
| tableVLookUpValue | GUI HTML | NO |
| tableVLookUpXPath | GUI HTML | NO |
| takeScreenshot | GUI HTML | YES |
| type | GUI HTML | YES |
| typeAction | GUI HTML | NO |
| typeKeys | GUI HTML | NO |
| uncheckbox | GUI HTML | YES |
| validateAttribute | GUI HTML | YES |
| waitFor | GUI HTML | NO |
| waitForElement | GUI HTML | NO |
| waitForPageLoad | GUI HTML | NO |
| newConnect_Script | Script Generic | NO |
| execute_Script | Script Generic | YES |
| disconnect_Script | Script Generic | NO |
| connect_Script | Script Generic | NO |
| closeFile | Text Files | NO |
| containsText | Text Files | NO |
| countFileLine | Text Files | NO |
| countTextFile | Text Files | NO |
| deleteFtpFile | Text Files | NO |
| deleteSftpFile | Text Files | NO |
| generateFileAsEvidence | Text Files | YES |
| getFileText | Text Files | NO |
| getFtpFile | Text Files | NO |
| getLineLength | Text Files | NO |
| getNumColumns | Text Files | NO |
| getOwner | Text Files | NO |
| getReadLine | Text Files | NO |
| getSize | Text Files | NO |
| getSftpFile | Text Files | NO |
| getTableValue | Text Files | NO |
| getTextFileData | Text Files | YES |
| lineContainsText | Text Files | NO |
| loadCsvData | Text Files | YES |
| newFile | Text Files | NO |
| openFile | Text Files | NO |
| openNewFile | Text Files | NO |
| putFtpFile | Text Files | NO |
| putSftpFile | Text Files | NO |
| replaceText | Text Files | NO |
| writeEnter | Text Files | NO |
| writeTo | Text Files | NO |
| assertion | User Object | NO |
| compareParameters | User Object | NO |
| compareVariables | User Object | NO |
| copyFile | User Object | NO |
| dateAddition | User Object | NO |
| dateDifference | User Object | NO |
| dateWeekDay | User Object | NO |
| executeCommand | User Object | NO |
| executeJavaScript | User Object | NO |
| failTest | User Object | NO |
| getCurrentDate | User Object | NO |
| getCurrentDateAsDate | User Object | NO |
| getCurrentDateAsString | User Object | NO |
| isExistVariable | User Object | NO |
| manualTast | User Object | YES |
| removeVariable | User Object | NO |
| replaceAll | User Object | NO |
| saveRepositoryAsEvidence | User Object | YES |
| sendKeys | User Object | NO |
| sendKeysCombination | User Object | NO |
| sendKeysPaste | User Object | NO |
| setArrayVariable | User Object | NO |
| setVariable | User Object | NO |
| systemCloseProgram | User Object | NO |
| takeScreenshot | User Object | YES |
| waitFor: | User Object | YES |
| deleteRest | API/WebService | YES |
| getALLXMLElementValueByTagName | API/WebService | YES |
| getCookieValue | API/WebService | NO |
| getHeaderValue | API/WebService | NO |
| getHTMLElementValueByXPath | API/WebService | NO |
| getJSONElementValueByJsonPath | API/WebService | NO |
| getJSONElementValueByTagName | API/WebService | NO |
| getRest | API/WebService | YES |
| getResponseStatus | API/WebService | NO |
| getResponseTime | API/WebService | NO |
| getXMLElementValueByXPath | API/WebService | NO |
| getXMLElementValueByTagName | API/WebService | NO |
| patchRest | API/WebService | YES |
| postRest | API/WebService | YES |
| putRest | API/WebService | YES |
| responseBodyContainsText | API/WebService | NO |
| setNoneAuthentication | API/WebService | NO |
| setBasicAuthentication | API/WebService | NO |
| setBearerTokenAuthentication | API/WebService | NO |
| setDigestAuthentication | API/WebService | NO |
| clearAndWriteField | Host 3270 | YES |
| clearField | Host 3270 | YES |
| containsText | Host 3270 | YES |
| getLenghField | Host 3270 | NO |
| nextScreen | Host 3270 | YES |
| previousScreen | Host 3270 | YES |
| readField | Host 3270 | YES |
| readRow | Host 3270 | YES |
| readScreen | Host 3270 | YES |
| readScreen | Host 3270 | YES |
| rowContainsText | Host 3270 | YES |
| waitCRC | Host 3270 | NO |
| waitFor | Host 3270 | NO |
| waitForChange | Host 3270 | YES |
| waitForText | Host 3270 | YES |
| writeAfterLabel | Host 3270 | YES |
| writeBeforeLabel | Host 3270 | YES |
| writeField | Host 3270 | YES |
| writeKey | Host 3270 | YES |
| writeKeyUntilFind | Host 3270 | YES |
| writeText | Host 3270 | YES |
| checkTextInSlide | NO | |
| checkTextOnDocument | NO | |
| checkTextOnPage | NO | |
| checkTextOnPageArea | NO | |
| generateFileAsEvidence | YES | |
| getGetTextByPageArea | YES | |
| getNumPages | NO | |
| getNumWhitePages | NO | |
| getPageAsImage | YES | |
| getPageText | YES | |
| getTextCountOnDocument | NO | |
| getTextCountOnPage | NO | |
| isPageWhite | NO | |
| generateFileAsEvidence | XML | YES |
| getElementAttrTextByXPath | XML | NO |
| getElementsCountByTagName | XML | NO |
| getElementsCountByXPath | XML | NO |
| getElementsTextByTagName | XML | YES |
| getElementsTextByXPath | XML | YES |
| getElementTextByTagName | XML | NO |
| getElementTextByXPath | XML | NO |
| replaceElementAttrTextByXPath | XML | NO |
| replaceElementTextByTagName | XML | NO |
| replaceElementTextByXPath | XML | NO |
| saveAs | XML | NO |
| saveXml | XML | NO |
| xmlToString | XML | NO |
| executeAllServiceOperations | SOAP UI | YES |
| executeAllTestSuite | SOAP UI | YES |
| executeServiceOperation | SOAP UI | YES |
| executeTestCase | SOAP UI | YES |
| executeTestStep | SOAP UI | YES |
| executeTestSuite | SOAP UI | YES |
| executePostmanCollection | Postman Collection | YES |
| getResponseBody | Postman Collection | YES |
| getResponseStatusCode | Postman Collection | YES |
You can use the following keyboard shortcuts in the canvas:
| Shortcut | Description |
|---|---|
| ESC | Close menus and selects the pointer. |
| Alt + 9 | DUnlocks diagrama for editing. |
| Alt + P | Selects the pointer tool. |
| Alt + O | Selects the “Object” tool. |
| Alt + M | Selects the “Message” tool. |
| Alt + R | Selects the “Reply message tool”. |
| Alt + G | Selects the “Gate” tool. |
| Alt + A | Selects the “Combined Fragment: ALT” tool. |
| Alt + D | Selects the “Combined Fragment: DO WHILE” tool. |
| Alt + W | Selects the “Combined Fragment: WHILE” tool. |
| Alt + F | Selects the “Combined Fragment: FOR” tool. |
| Alt + E | Selects the “Combined Fragment: FOR EACH” tool. |
| Alt + S | Selects the “Subtestcase” tool. |
| Ctrl + C | Copy selected elements. |
| Ctrl + V | Paste copied elements. |
| Ctrl + Z | Undoes some actions such as: Delete elements, Redistribute diagram, etc… |
| Double click | Edit element: double click on a diagram element to edit its properties. |
| Right button | Context menu: by right-clicking on an element, you can access the dynamic context menu. The options of this menu vary and can appear active/not active, depending on the currently selected elements. |
| Mouse Wheel | Zoom in/Zoom out: Roll the mouse wheel forward or backward to zoom in or zoom out the canvas respectively. |
| Shift + click | Multiple selection: hold down the shift key and click on different elements to select them. |
| Shift + drag | Multiple scrolling: hold down the shift key while scrolling the selected elements. |
| Click + drag | Move diagram: click on an empty area of the diagram while dragging in any direction to move the diagram. |
This tool option allows the user to select one or more messages one by one, in block or alternate.
SELECT MULTIPLE MESSAGES INDIVIDUALLY.
We can select several messages, one by one, it is done with the 'M' key pressed.
1. SELECT MESSAGES. 1.1. If we click on a message with the 'M' key pressed, a message is selected. (In the image message 1 is selected).

1.2. If we press the 'M' key and click on different messages, each one will be added to the selection. (Messages 3, 6 and 9 have been added to the selection in the image).

UNCHECK MESSAGES.
With the 'M' key pressed, if we click on a message already marked, it will be unmarked.
If we do this without pressing the 'M' key, the multiple selection will be lost and only the selected message will be marked.
SELECT MESSAGES BETWEEN TWO UNIQUE SELECTIONS.
We can select a message line by pressing the 'L' key and clicking on two unique
messages, this will mark all the messages between those two selected.
1. SELECT MESSAGES.
1.1. To select the first message we can:
- Click on the first message WITHOUT PRESSING the 'L' key.
- Click on the first message by pressing the 'L' key.
(In the image the first message marked is message 3).

1.2. To select the second message:
-We have to do it by ALWAYS PUSHING the 'L' key.
1.2.1. If the message of the second click is above the first one, the messages between those two are selected. (In the image on the next page, the first message selected was 3 and the second message marked was the message: message 1, all messages from 1 to 3 being marked). (In the image the first message marked is message 3).

1.2.2. If the message of the second click is below the first one, the messages between the two are selected.
(In the next image the first selected message was 3 and the second message marked was the message: message 10, all messages from 3 to 10 being selected).

2. DESELECT MESSAGES.
If we want to unmark an intermediate message, we can do it by pressing ONLY the 'M' key and clicking on the messages that we want to unmark. (In the image, the unmarked messages are 5 and 9).

3. INTERCHANGE BLOCKS.
Example of use to be able to interleave selections of several groups.
3.1. We select a message line by holding down the 'L' key. (A block of household items 1 to 6 has been selected in the picture).

3.2. We could deselect one or several messages to personalize the group of messages and eliminate some of them. (In this picture the message 4 has been deselected).

3.3. If, for example, we want to add the block of messages 9, 10 and 11 to this selection, we would have to follow the following steps:
3.3.1. To select the first message of this sub-block we would do it by pressing the 'M' key. To add that unique message to the selection. The first message could be 9.
3.3.2. To select the second message of the sub-block we would do it by pressing the 'L' key and we would add all the messages between those two selections. The second selected message would be 11.
The result is this serious selection that we have marked alternate message blocks. The messages “1, 2, 3” are selected in the image; “5, 6”; “9, 10, 11”).

COPY AND STICK MULTIPLE MESSAGES IN A DIAGRAM.
1. We select the messages that interest us with the different selection options offered by the application.
2. Copy and paste messages:
You can copy and paste the selected messages with the key combination: “ctrl + sifth + c” and to paste them it would be with the key combination “ctrl + sifth + v”.
3. You do NOT have to be able to paste messages from one diagram into another diagram:
If you copy and paste a single message or several, they can only be pasted on the diagram where they are drawn.
4. Reply Messages:
- If we select only a reply message, it does not allow copying.
- If we select the source message to which a reply is associated, both are copied.
DISPLACING MULTIPLE MESSAGES IN A DIAGRAM.
1. We select the messages that interest us with the different selection options offered by the application.
2. Move a group of messages:
When we have selected the last message of the selection, do not raise the left mouse button, leave it pressed and when moving the mouse upwards or downwards the block will follow the movement.
DELETE MULTIPLE MESSAGES FROM A DIAGRAM.
1. We select the messages that interest us with the different selection options offered by the application.
2. Delete a group of messages:
We can delete a group of messages with the 'DELETE' key or with the 'Delete item' button of the diagram tools.
TAST has an important help when mapping objects and messages in a diagram: Selective Mapping.
The configuration, how to use the functionality, and some considerations are explained in the document below:
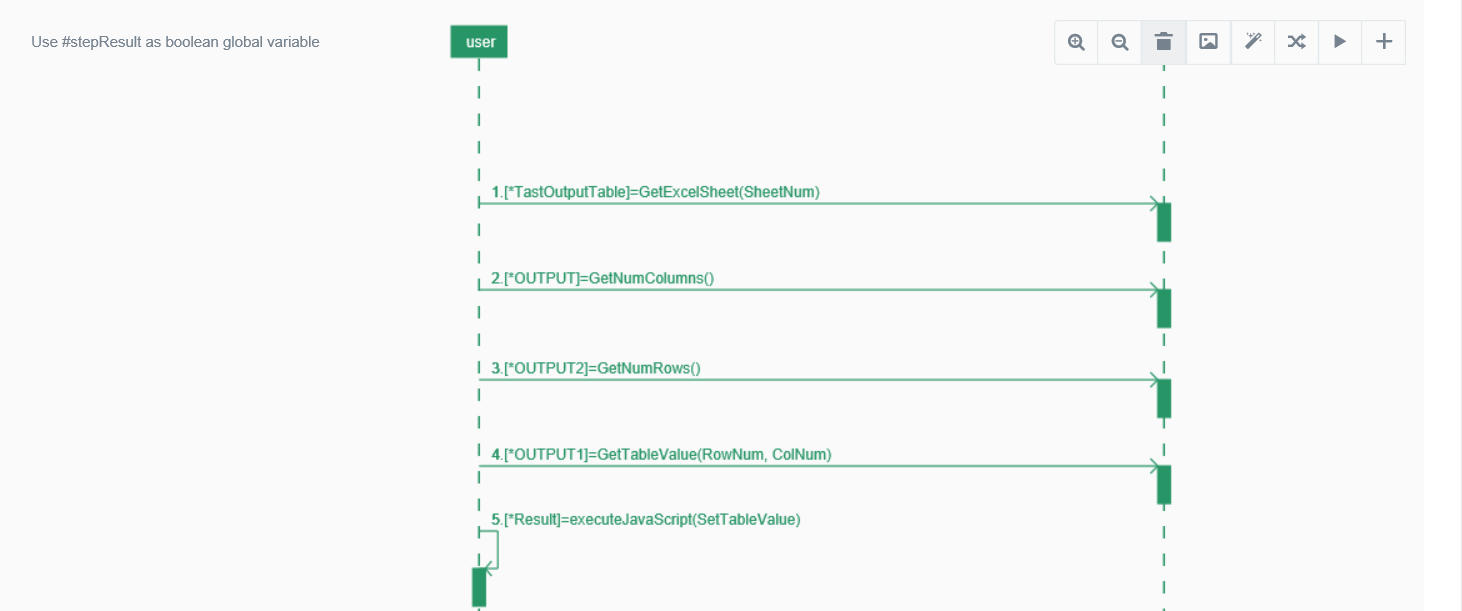
In an UML diagram, TAST allows the use of variables of a specific type of table, called TASTTABLEDATA.
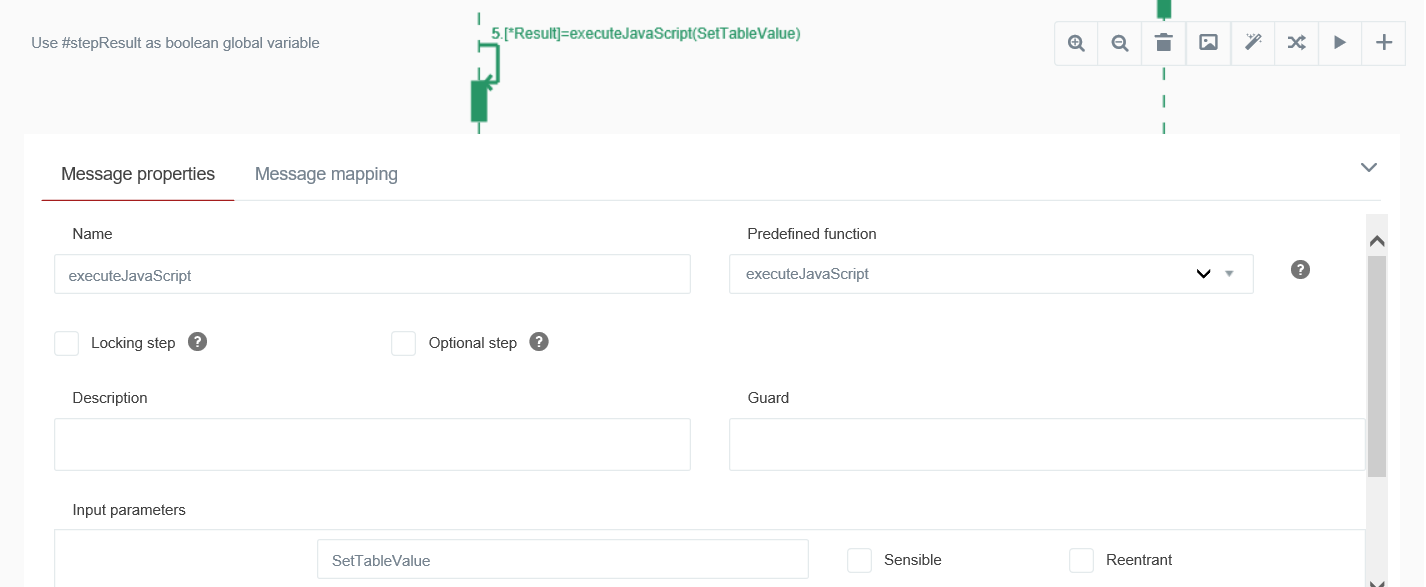
These variables can be used with practically all the adaptors available in TAST (HTML GUI, Excel Files, Database, …). They can be used in the “Value” box of a Predefined Function or in Javascript.
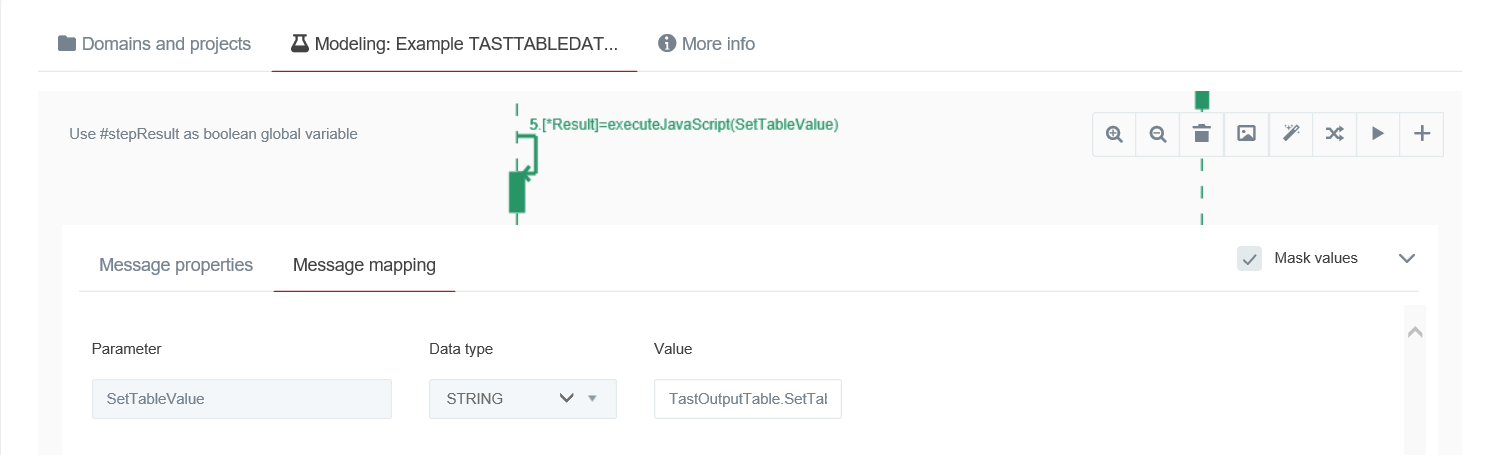
Once the TASTTABLEDATA variables have been created (as output variables), they can be used as input variables in subsequent messages. The way to use them in a “Value box” is:
#TastTableDataVariableName.functionName(params…).
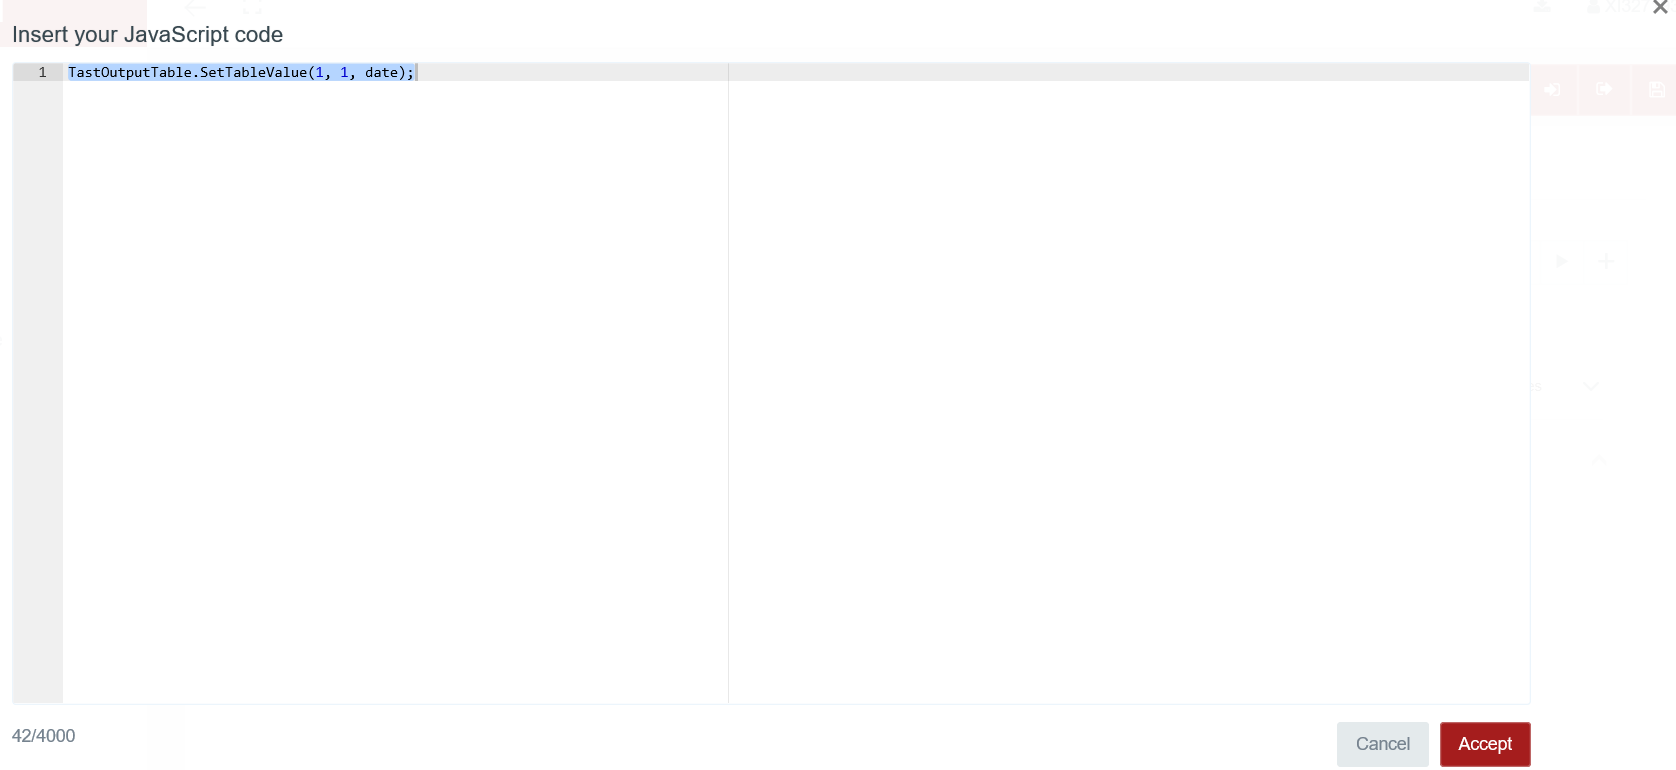
From javascript, you will use the syntax functionName(params…)
The functions currently available are:
| Output | Function | Description |
|---|---|---|
| int | getNumColumns() | Returns an integer with the number of columns. |
| int | getNumRows() | Returns an integer with the number of rows. |
| String | getStringValue() | Returns a string containing the content of the table separating cells with | and rows with ||. |
| TastRowTableData | getTheRow(int index) | Returns a row. |
| N/A | addRowData(TastRowTableData rowData) | Adds a row at the end of the table. |
| TastRowTableData | getTheColumn(int index) | Returns a column (as a row). |
| TastDataGeneric | getCellValue(int row,int column) | Returns the value of a specific cell. |
| TastDataGeneric | getTableValueByColumnName(int rowNum, String columnName) | Returns the value of a cell identified by row number and Column name. |
| N/A | setTableValue(int row, int column, String value) | Allows to add a value to a specific cell. The value can be a string, Float or Boolean value, either contained in a variable or hardcoded: |
TAST allows the use of variables of a specific type of row, called TASTROWVALUES.
These variables can be used with practically all the adaptors available in TAST (HTML GUI, Excel Files, Database, …). They can be used in the “Value” box of a Predefined Function or in Javascript.
Once the TASTROWVALUES variables have been created (as output variables), they can be used as input variables in subsequent messages.
The way to use them in a “Value box” is: #TastRowDataVariableName.functionName(params…)
From javascript, you will use the syntax functionName(params…)
The functions currently available are:
| Output | Function | Description |
|---|---|---|
| N/A | addCellValue(String value) | Allows to add a cell at the end of the TastRowValues. |
| String | getCellValue(int index) | Returns the content of a specific cell. |
| int | getLength() | Returns the number of cells of the TastRowValues. |
| String | getStringValue() | Returns the content of the row separating cells with | |
For more information about Variables Management, see the topic “Variable Management”.
TAST has an important feature: the Canvas, which is a place where the user can paint the UML diagrams. Actually, the Using TAST workflow starts from its Canvas.
You can launch the Canvas from several places:

The toolbox on top has the following options:

Once editing a Diagram, a second toolbar will be shown to make interaction with the diagram easier. The following options are available:
In this toolbox, you have all the items you can use for painting your UML diagrams. The list of UML elements you can use is the following:
GATES
Gates could be regarded as being a simple way to model the passing of data between a sequence diagram and its context. A Gate is a message that is highlighted with one end connected to the sequence diagram’s frame’s edge and the other end connected to a lifeline.
 When you choose a Gate for being used, firstly, you should provide a name and a path to the diagram you are referencing as a gate. The second step is to decide the execution way:

With this option it will be possible to manage the data sets with which the tests corresponding to a specific diagram will be launched.
The DATA MANAGEMENT option has three tabs:
 Displays the list of diagrams for a specific domain and project, with information about their test case data sets and test case sets.
In general, we can filter by:
Displays the list of diagrams for a specific domain and project, with information about their test case data sets and test case sets.
In general, we can filter by:
It will also allow you to modify and delete a folder.
In the main window of DATA MANAGEMENT, the list of diagrams for the filters used will be displayed, with the following information:
 In this window the data of the test cases of a diagram will be created.
Is accessed by clicking on any diagram of the Test Sets Data window.
In this window the data of the test cases of a diagram will be created.
Is accessed by clicking on any diagram of the Test Sets Data window.
There will be a set of validation data and 1 to n data sets of values. It will be possible to indicate:
You can also view the diagram.
There will be the option to copy the data of the test cases, which can be modified later.
 It can be accessed on two ways:
This screen shows the following information:
Back in the Test Set Data Window, we have another functionality to delete massively the Test Case Data (TCD) created for that Test Set (TS).
A new icon with a trash bin inside is located in the upper icon bar.

Once this button is clicked a modal window with all the TCD list will appear.

Different features in this modal window:
In this page you can also to import data from an Excel file. You just need to click in the Import icon to show the Import TC file page.

Then,
After you select the file and set the correspondence, you should click the button Import to perfom the import process.

This TAST option allows the user to do a search of a diagram among all the domains of the application (TAST also allows the filtering of Test Set in TS Management in all domains).
There are two types of searches:
To use the search of an UML diagram, follow these steps:

Click on the filter button of all domains and projects.
Search by diagram ID

In the search field you type the diagram ID of the search you want to perform, and click on the magnifying glass button. The application shows the diagram with the specified ID in the search.
If you click on the file icon, the diagram will open directly:

Search by diagram name

In the search field you type the characters of the search you want to perform, and click on the magnifying glass button. The application shows all the diagrams of all the domains that contain the characters entered in the search.
If you click on the list icon, the application will switch to the selected Diagram, Domain and Project:

This TAST option allows the user to do a search of a diagram (and its Test Case Data) among all the domains of the application (TAST also allows the filtering of Test Set in TS Management in all domains).
There are two types of searches:
To use the search of an UML diagram in Data Management, follow these steps:
In Modeling, select the Data Management Option.

Click on the filter button of all domains and projects.

Search by diagram ID
In the search field you type the diagram ID of the search you want to perform, and click on the magnifying glass button. The application shows the Test Set Data corresponding to the diagram with the specified ID in the search.
If you click on the file icon, the Test Set Data will open directly:

Search by diagram name

In the search field you type the characters of the search you want to perform, and click on the magnifying glass button. The application shows all the diagrams of all the domains that contain the characters entered in the search.
If you click on the list icon, the application will switch to the selected Test Case Data, Domain and Project:

Clicking on the diagram, you can see the Test Case Data of the selected diagram.
In this tab, all the repositories that the users are going to use in the diagrams will be stored The repositories are TXT or YML files (they must have YML /YAML format) that we create and upload to this tab and contains information that we can use in a diagram.
To evade confusions with the functionality, and to briefly explain how to create repositories we have to know the details about the elements used here. Next we have a detailed example:


In the repository management we have different “features”:

In the repository management tab, we have to click the import button in the top right side, then a modal window will appear.

In this modal window, we choose the name of the repository, domain and project also the name and where to save it.

Once it is ready, we click import, if the TXT/YML file is ok, the importation will be perfect. But if the file has some kind of error, this message will appear:

This could happen if: the TXT format is not YML/YAML, or because there are some kind of error in the file also could be because the syntaxis of the yml in the repository is wrong like inserting spaces with tab instead spacebar or using a key as subkey of another when the value is already defined.
In modeling are some changes about repositories as well.


